Templates
The following templates provide quick setup of GUIs for common instrument components. These GUIs are designed to be intuitive and self-explanatory. See the Advanced section for detailed user guides on each GUI component, if needed.
1D Frame, Single Frame per Run
Scenario: Acquire a spectrum with a 1D detector, one frame per run.
To use this template, provide your own motor and detector instances:
motor = ...  # your motor instance
detector = ...  # your detector instance
detectorName = "nameOfYourDetector"

def Window():
    from lys_instr.templates.template1 import TemplateWindow
    return TemplateWindow(motor, detector, detectorName)
For demonstration, here is a realistic example. Suppose we have a detector that acquires optical spectra, that is, pairs of wavelength and intensity values. We rotate a polarizer (motor axis “phi”) in the optical path and acquire a spectrum at each angle. The detector collects a single spectrum (1D frame) per run.
We use a dummy motor to simulate polarizer rotation and a dummy detector to simulate spectrum acquisition. The example data are polarization-dependent Raman spectra of FePS3, at 10 K (background-subtracted), measured in 10° increments of the polarizer angle.
from lys_instr import dummy
from lys_instr.dummy.detectorData import RamanData

motor = dummy.MultiMotorDummy("phi")
detector = dummy.MultiDetectorDummy(data=RamanData(scanLevel=0), exposure=0.1)
detectorName = "MultiDetectorDummy"

def Window():
    from lys_instr.templates.template1 import TemplateWindow
    return TemplateWindow(motor, detector, detectorName)
Add the above code to proc.py in lys, and call this Window() from the lys command line to launch the GUI subwindow, as shown below:
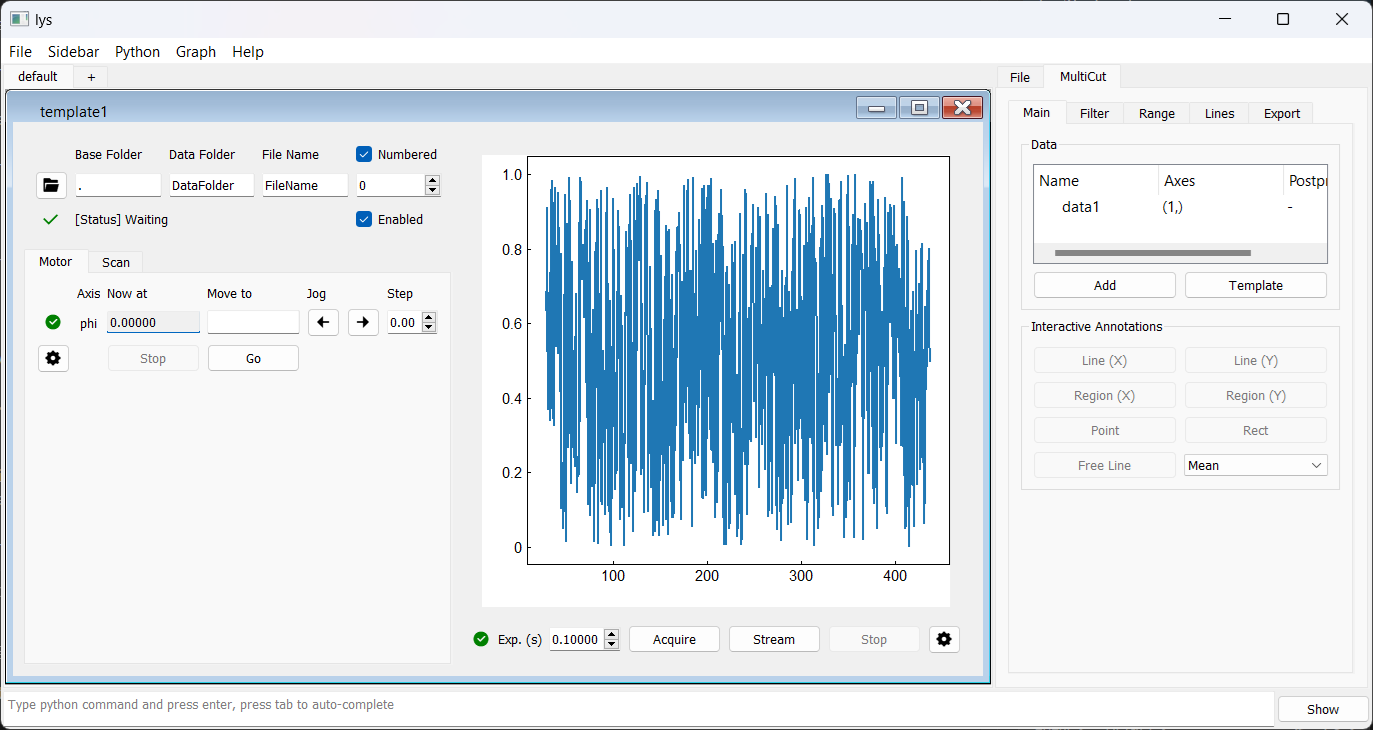
In the Scan tab, configure the scan by selecting the motor axis “phi”, setting the scan range (for example, start at 0, step by 10, for 36 steps), and specifying the exposure time (for example, 0.1 seconds).
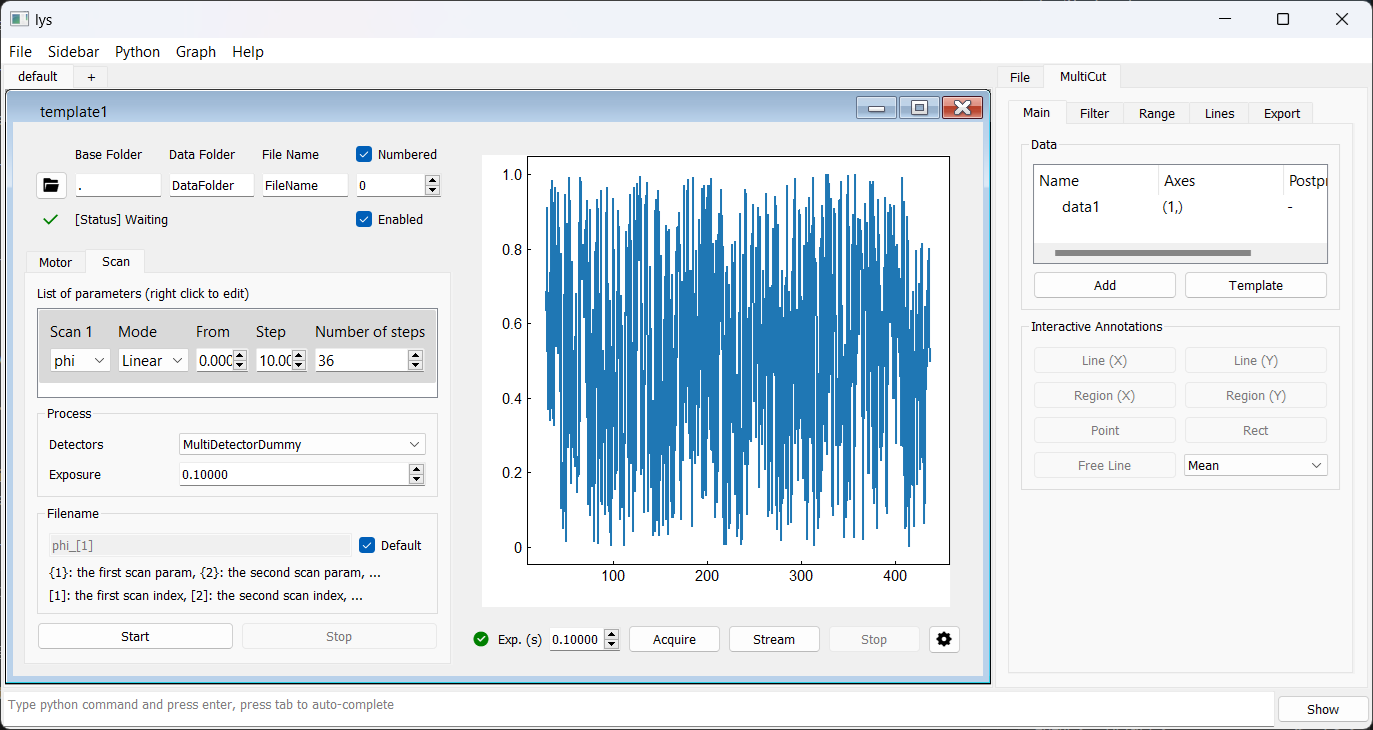
Clicking the Start button begins the scan, acquiring spectra at each polarizer angle.
A straightforward extension is to add more motor axes for scanning, using the same template. For example, adding the “x” and “y” axes allows you to move the sample stage and perform spatial mapping of the spectra.
This is simulated by adding the “x” and “y” axes to MultiMotorDummy:
motor = dummy.MultiMotorDummy("x", "y", "phi") # Add "x" and "y" axes for spatial mapping
Update the motor initialization line in proc.py and call Window() to relaunch the GUI subwindow.
In the Scan tab, add scan loops for the “x” and “y” axes below “phi” to configure the mapping.
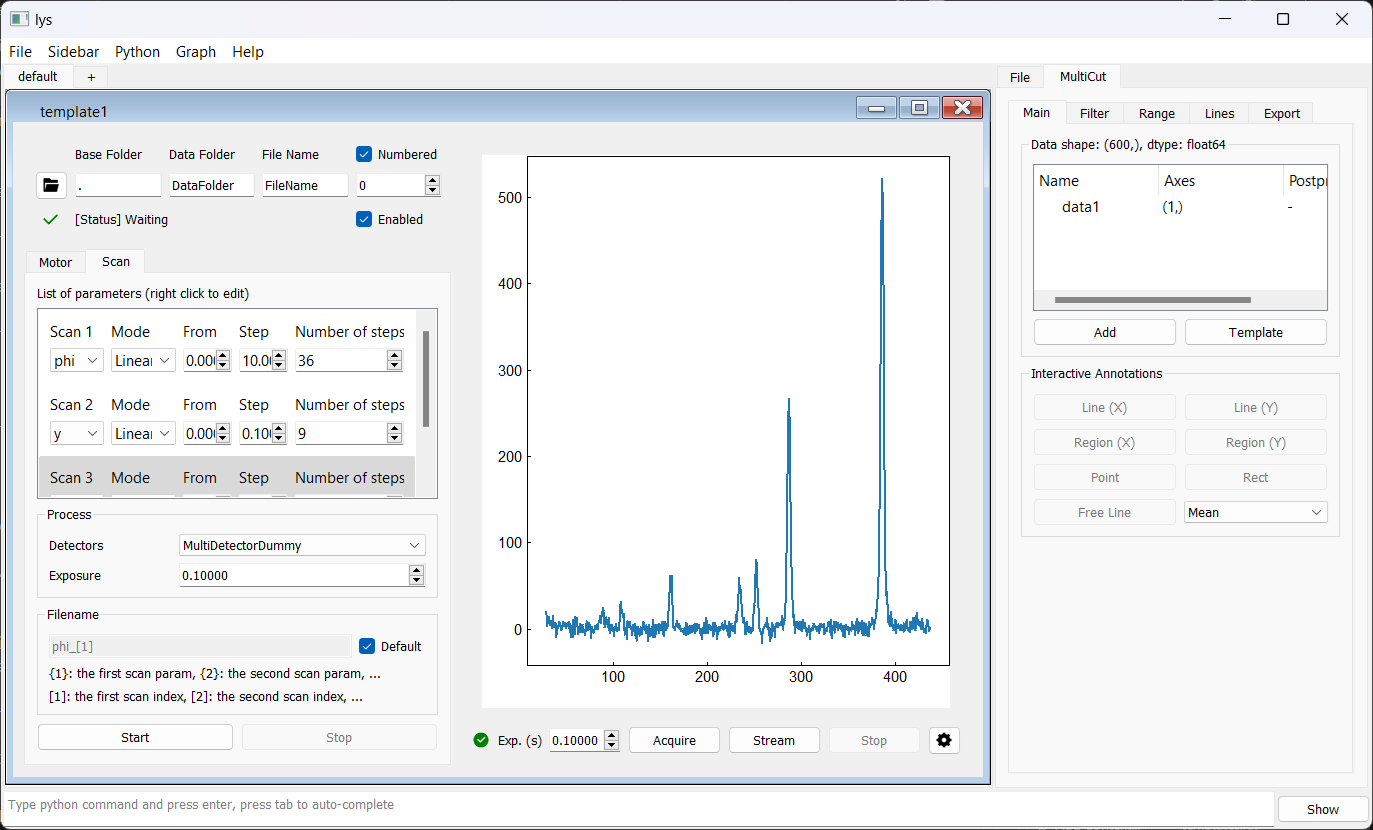
This setup performs a nested scan, acquiring data over an 8×9 grid by scanning the y-axis at each x-axis position, for 36 phi values. The snapshot above shows the first spectra acquired at the start of the scan.
1D Frame, Multiple Frames per Run
Scenario: Acquire spectra with a 1D detector, multiple frames per run.
To use this template, provide your own motor and detector instances:
motor = ...  # your motor instance
detector = ...  # your detector instance
detectorName = "nameOfYourDetector"

def Window():
    from lys_instr.templates.template2 import TemplateWindow  # Import from template2
    return TemplateWindow(motor, detector, detectorName)
For demonstration, we run the same experiment as before.
Now suppose the detector is configured to acquire 36 frames in a single run, with hardware managing both polarizer rotation and frame acquisition. During acquisition, each spectrum is sent to the GUI as a 1D frame, labeled by its index (from 0 to 35).
from lys_instr import dummy
from lys_instr.dummy.detectorData import RamanData

motor = dummy.MultiMotorDummy("x", "y")     # Omit "phi" since hardware manages polarizer rotation
detector = dummy.MultiDetectorDummy(data=RamanData(scanLevel=1), exposure=0.1)
detectorName = "MultiDetectorDummy"

def Window():
    from lys_instr.templates.template2 import TemplateWindow
    return TemplateWindow(motor, detector, detectorName)
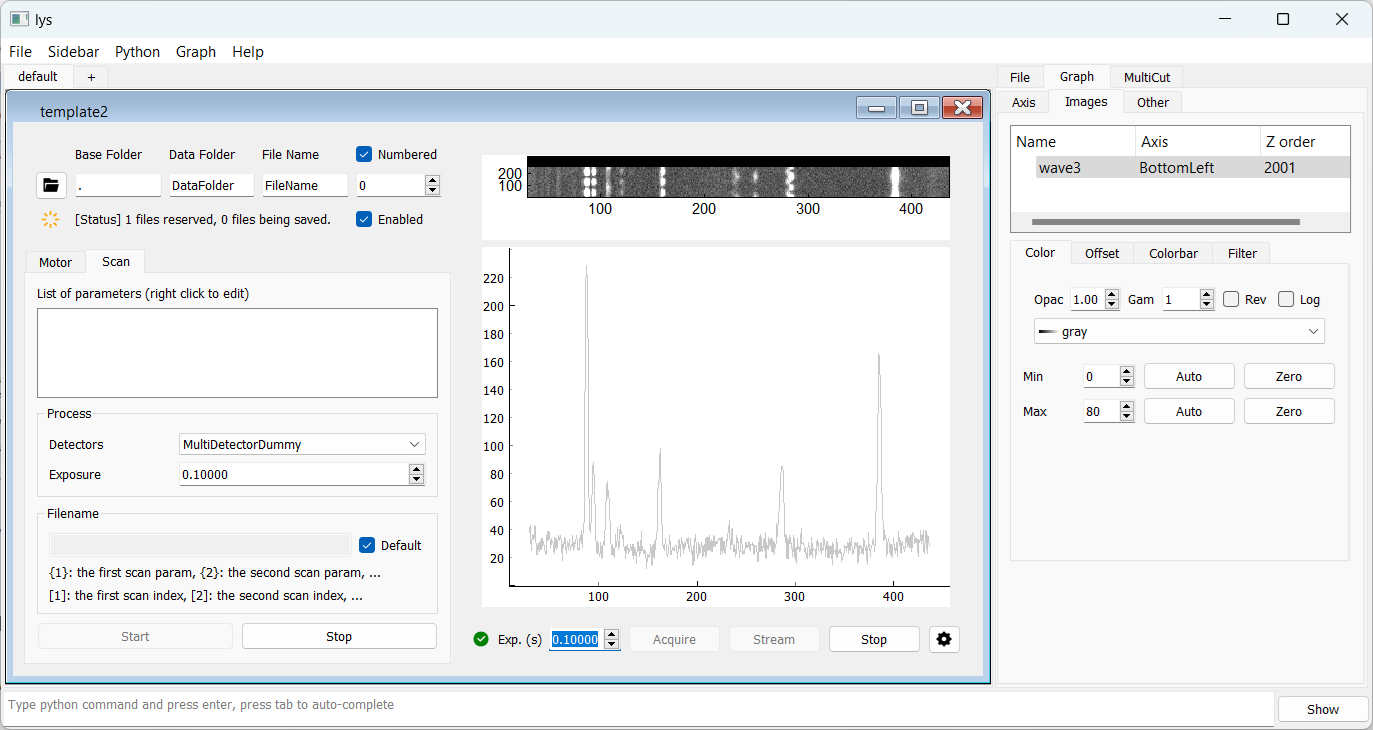
Add the above code to proc.py in lys, and call this Window() from the lys command line to launch the GUI subwindow, as shown below:
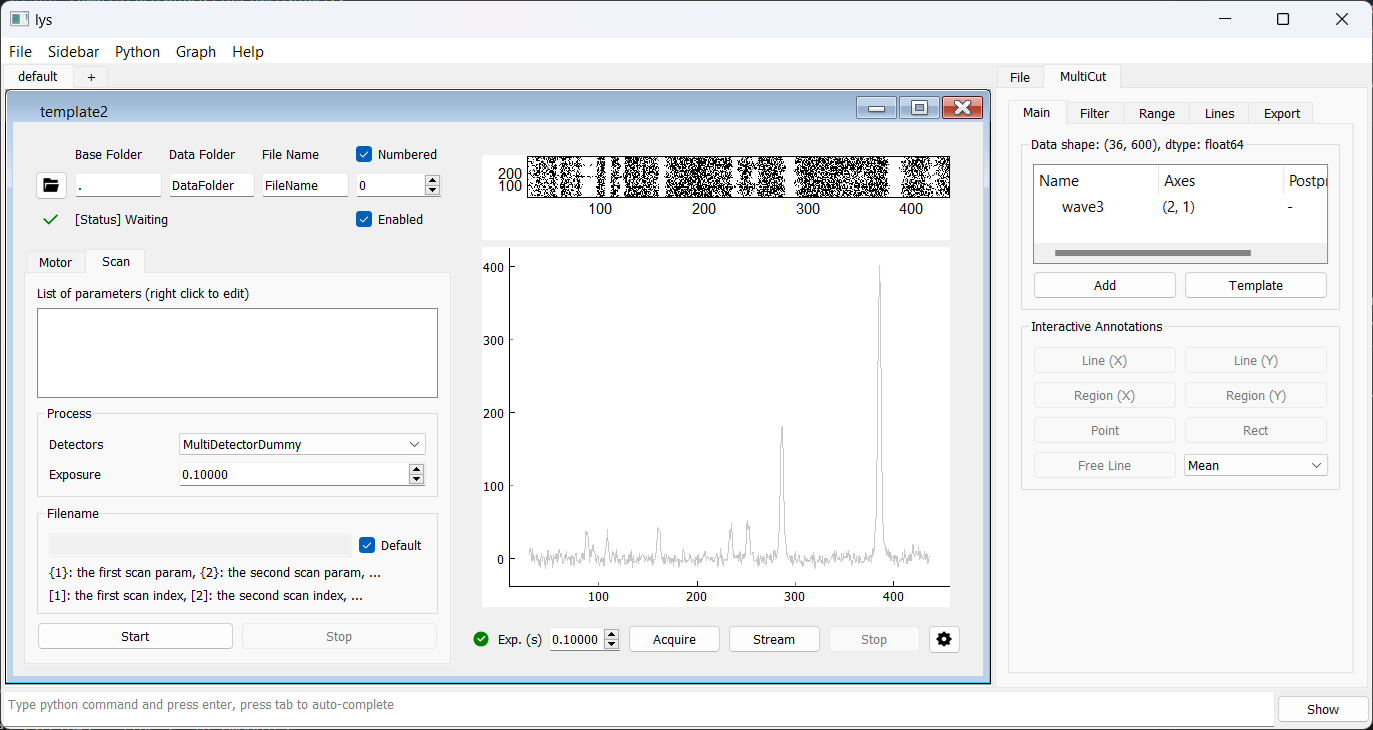
In the Detector panel, the upper plot displays the live-updated dataset as a 2D array and the lower one shows the live spectrum from the most recent frame.
Clicking the Start button with no scan loops configured begins a single 36-frame acquisition.
A live snapshot during acquisition is shown below. The grayscale of the upper plot can be adjusted during acquisition: double-click the plot area to open the Graph tab, open the Images tab under it, select the data item, and set the “Min” and “Max” values (see lys documentation for details on plot customization).
As before, you can enable spatial mapping by adding scan loops for the “x” and “y” axes in the Scan tab.
2D Frame, Single Frame per Run
Scenario: Acquire an image with a 2D detector, one frame per run.
To use this template, provide your own motor and detector instances:
motor = ...  # your motor instance
detector = ...  # your detector instance
detectorName = "nameOfYourDetector"

def Window():
    from lys_instr.templates.template3 import TemplateWindow
    return TemplateWindow(motor, detector, detectorName)
For demonstration, consider a realistic example: Suppose we operate an electron microscope whose detector captures 2D images. We move the sample stage using the “x” and “y” motor axes, capturing an image at each position. The detector acquires a single image (2D frame) per run.
We use a dummy motor to simulate stage movement and a dummy detector to simulate image acquisition, with each image filled with random noise.
from lys_instr import dummy
from lys_instr.dummy.detectorData import RamanData

motor = dummy.MultiMotorDummy("x", "y")     # Omit "phi" since hardware manages polarizer rotation
detector = dummy.MultiDetectorDummy(frameShape=(256, 256))
detectorName = "MultiDetectorDummy"

def Window():
    from lys_instr.templates.template3 import TemplateWindow
    return TemplateWindow(motor, detector, detectorName)
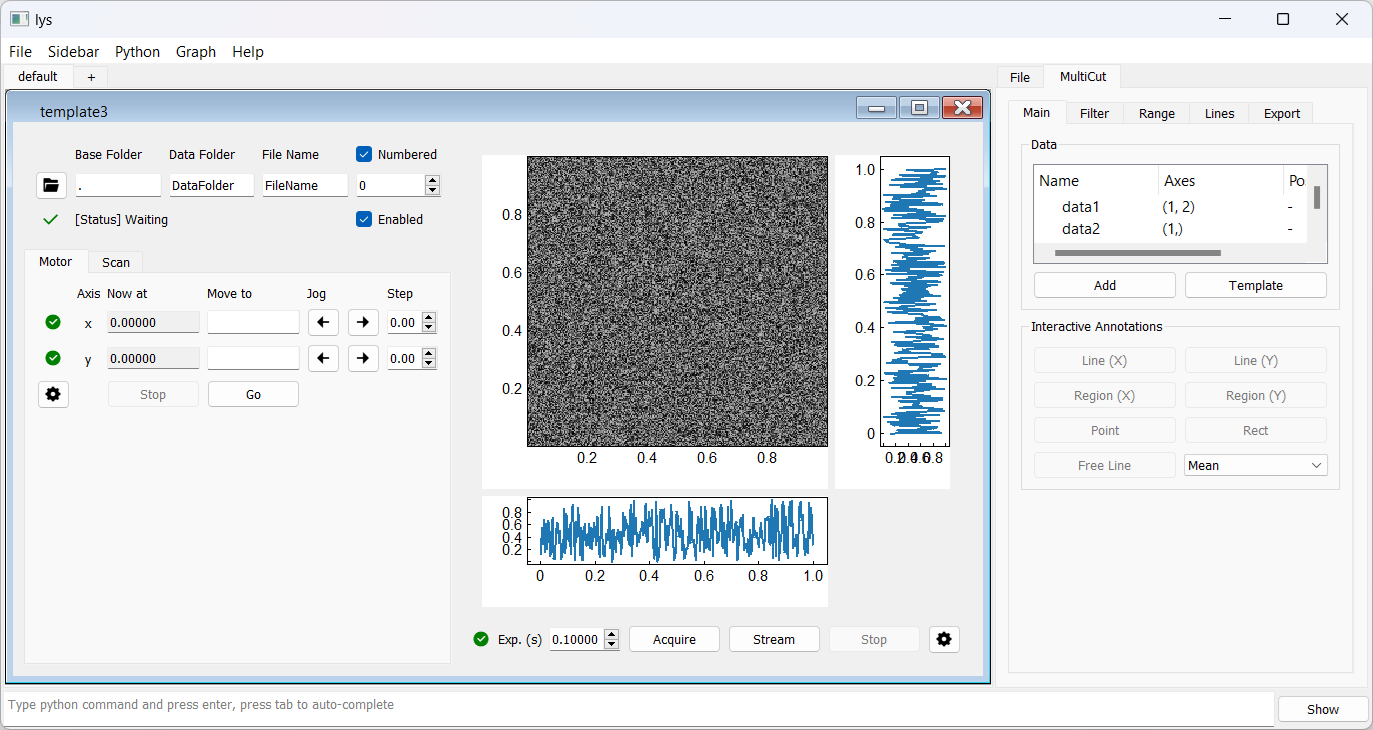
Add the above code to proc.py in lys, and call this Window() from the lys command line to launch the GUI subwindow, as shown below:
In the Scan tab, add scan loops for the “x” and “y” axes to configure the mapping. For example, the setup below performs a nested scan, capturing images over a 10×10 grid by scanning the x-axis at each y-axis position.
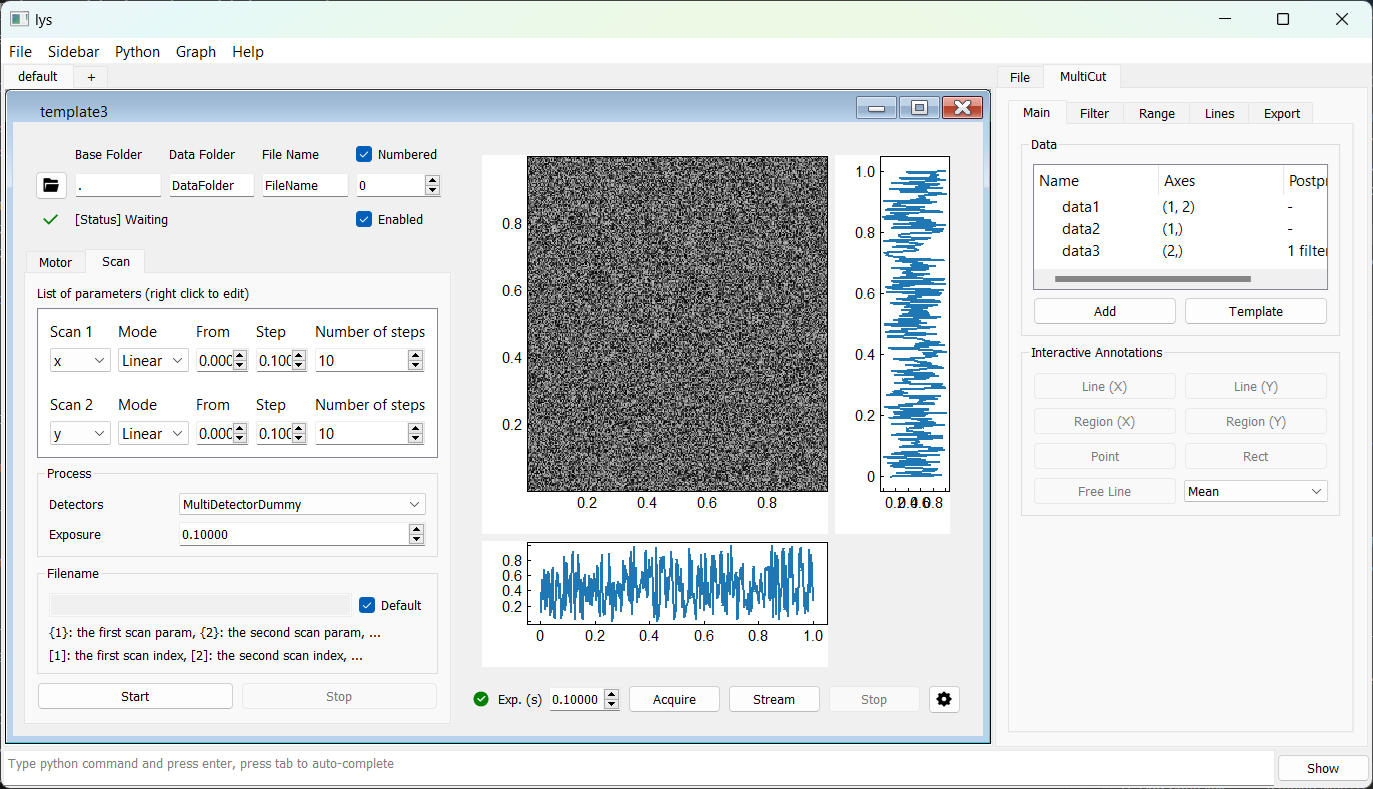
Clicking the Start button begins the scan, acquiring images at each grid point.
2D Frame, Multiple Frames per Run
Scenario: Acquire an image with a 2D detector, Multiple frames per run.
To use this template, provide your own motor and detector instances:
motor = ...  # your motor instance
detector = ...  # your detector instance
detectorName = "nameOfYourDetector"

def Window():
    from lys_instr.templates.template4 import TemplateWindow
    return TemplateWindow(motor, detector, detectorName)
For demonstration, consider a realistic example: Suppose the detector is configured to acquire a 2D array of 2D images in a single run, with hardware handling image acquisition and any required operations between acquisition events. During acquisition, each image is sent to the GUI as a 2D frame, labeled by its index within the array. This configuration exemplifies a 4D-STEM measurement, where the electron beam raster scans a 2D grid across the sample and records a 2D diffraction pattern at each grid position.
As in previous examples, use a dummy motor and dummy detector.
Set indexShape=(9, 9) to define the 2D array size, and frameShape=(256, 256) to specify the image size.
from lys_instr import dummy
from lys_instr.dummy.detectorData import RamanData

motor = dummy.MultiMotorDummy("E")     # For later use
detector = dummy.MultiDetectorDummy(indexShape=(9, 9), frameShape=(256, 256))
detectorName = "MultiDetectorDummy"

def Window():
    from lys_instr.templates.template4 import TemplateWindow
    return TemplateWindow(motor, detector, detectorName)
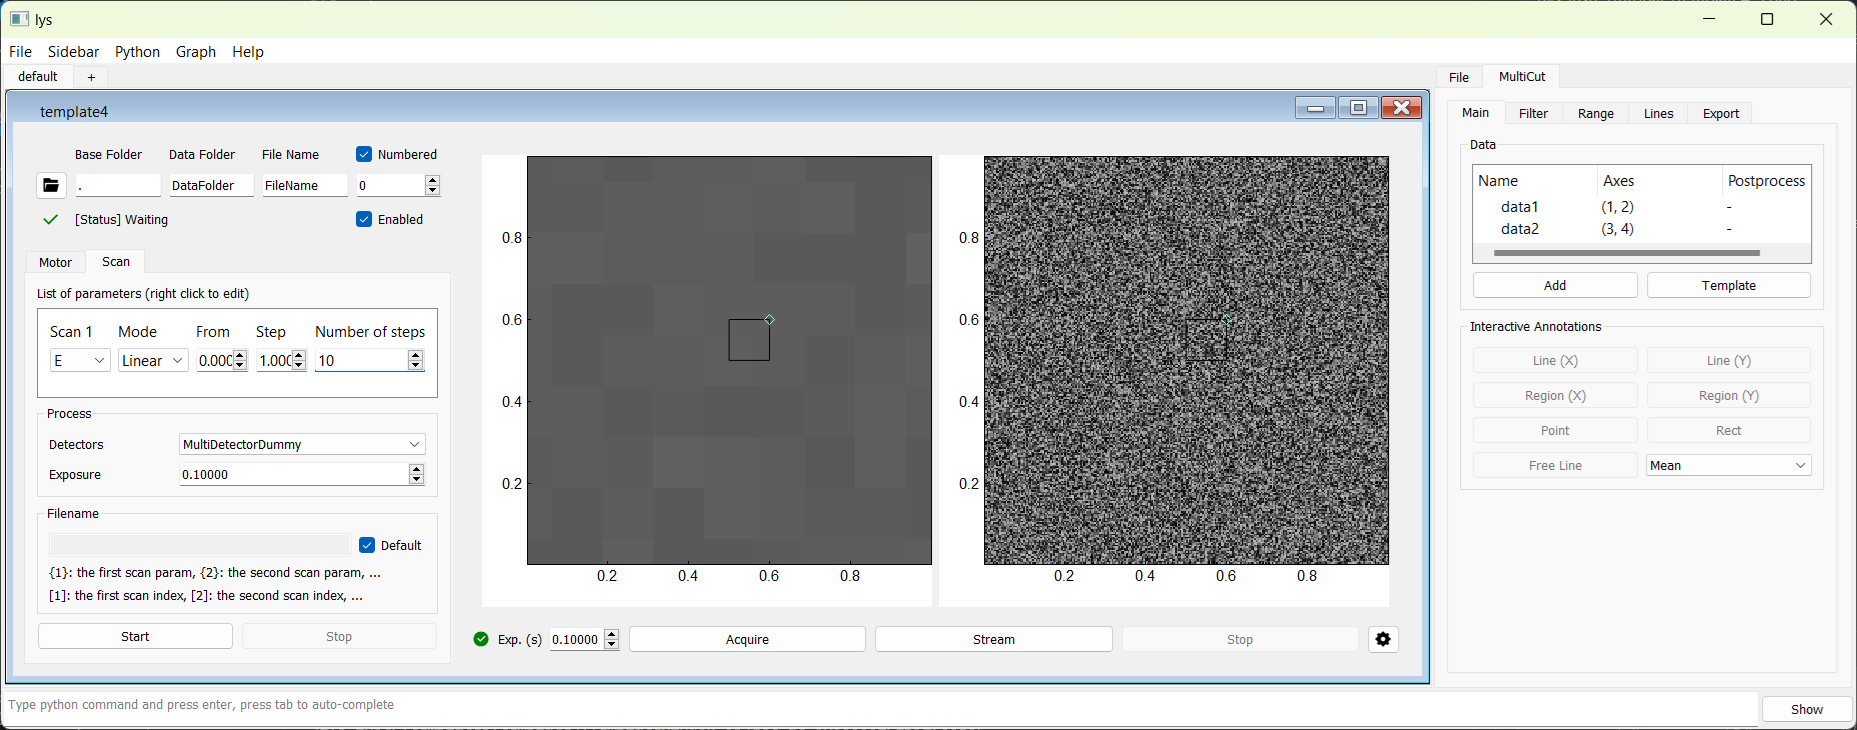
Add the above code to proc.py in lys, and call Window() from the lys command line to launch the GUI subwindow, as shown below:
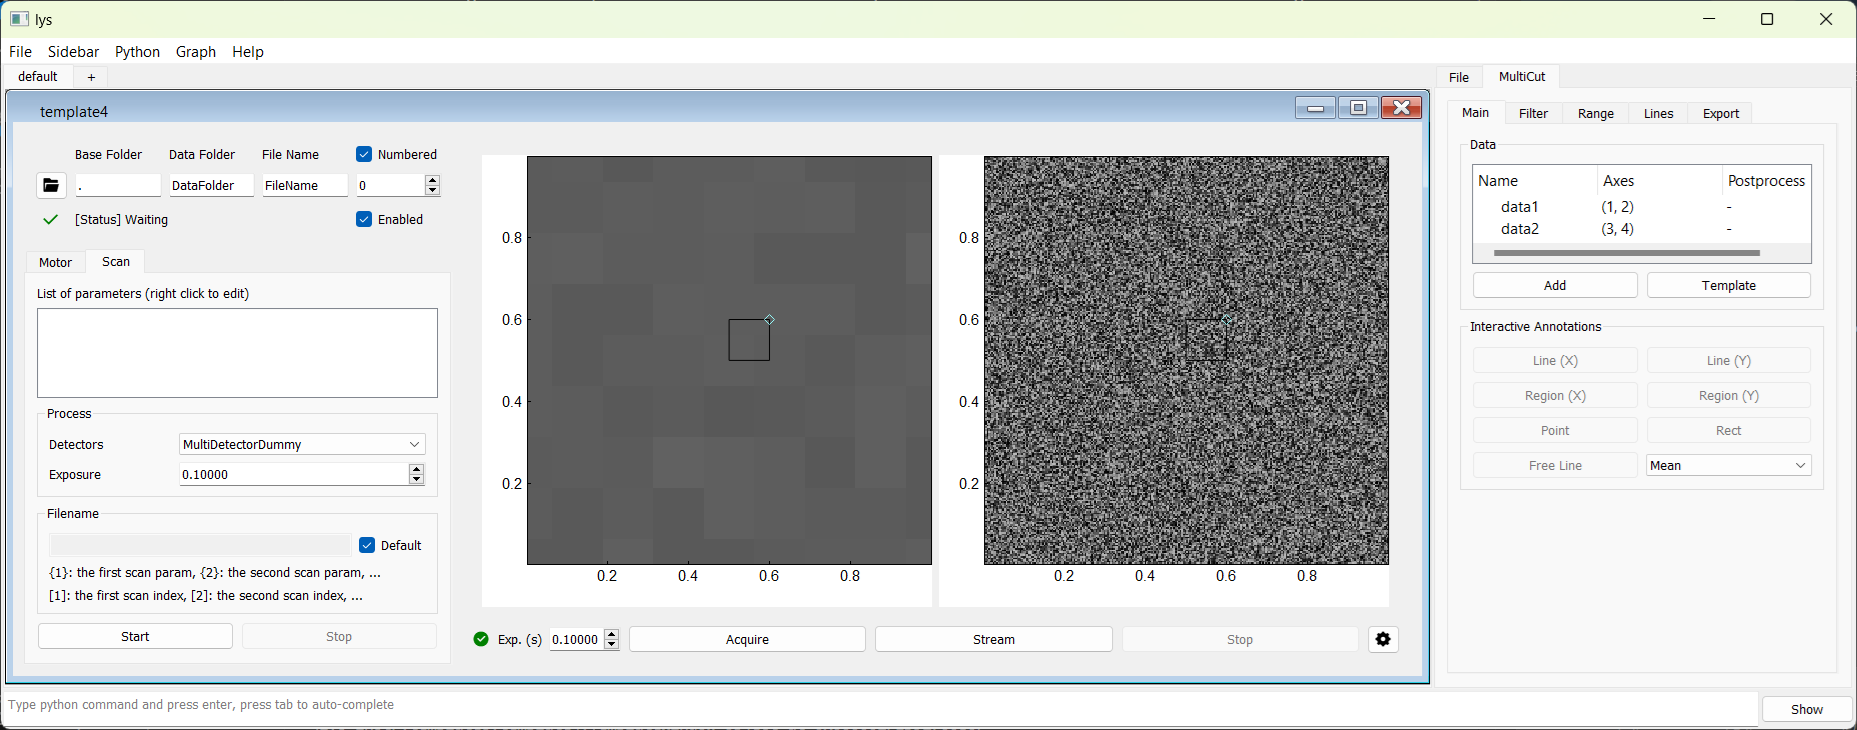
In the Detector panel, the left image displays the mean 2D array at each pixel, and the right image shows the mean of frames selected from the left image. You can interactively select a region in the left image to update the right image (see lys documentation for details on high-dimensional data visualization and analysis).
Clicking the Start button with no scan loops configured acquires the complete 8×8 dataset in a single run.
As before, you can add motor axes for scanning in the Scan tab. For instance, you can perform 4D-STEM measurements at each step while sweeping the electric field applied to the sample. Suppose the motor axis “E” controls the electric field:
Variations
These templates can be readily adapted for a variety of experimental scenarios. For example:
Add a time axis (using a motor for a delay stage in ultrafast laser experiments) and a switch instance to perform pump-probe measurements.
Add a corrector instance to configure motor axis dependencies and cooperative axis motions.
Refer to the Advanced sections for detailed user guides on each component’s GUI and for instructions on creating custom GUIs tailored to specific workflows.